Social media audit / Business project
Shuswap Coffee Company
A content strategy built from 19 months of social activity
August 2026Audit and strategy delivered
- Instagram posts reviewed
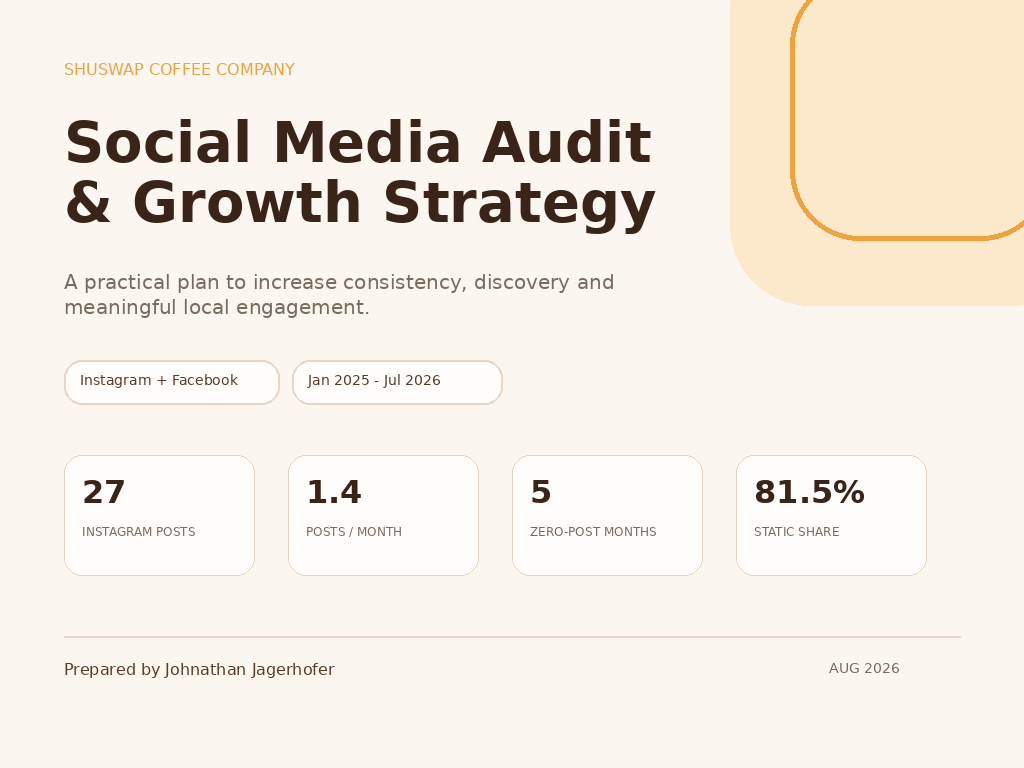
- 27
- Months in the audit
- 19
- Single-image posts
- 81.5%
- Months with no feed posts
- 5
Audit period: 1 January 2025 to 31 July 2026. Instagram counts come from 27 verified feed posts, with visible likes and comments available for 23. Facebook was reviewed through its public page. These figures describe the audit baseline; implementation results were not available.
The challenge
Identify what was limiting consistency and discovery, then create a realistic social content system that supports local engagement and customer action.
My role
I reviewed the public accounts, organised the post inventory, coded formats, content pillars and calls to action, analysed the visible performance, and prepared the growth strategy and presentation materials.
What I delivered
- Coded Instagram post inventory
- Publishing, format and CTA analysis
- Content pillars and recurring series
- 90-day action plan
- Monthly reporting framework
The evidence
What the audit showed.
2025
- 0Jan
- 1Feb
- 2Mar
- 2Apr
- 1May
- 2Jun
- 2Jul
- 0Aug
- 0Sep
- 2Oct
- 4Nov
- 2Dec
2026
- 2Jan
- 0Feb
- 1Mar
- 2Apr
- 2May
- 2Jun
- 0Jul
27 feed posts across 19 complete calendar months. Stories are excluded. Source: project post inventory, captured 1 August 2026.
Counts from all 27 verified Instagram feed posts.
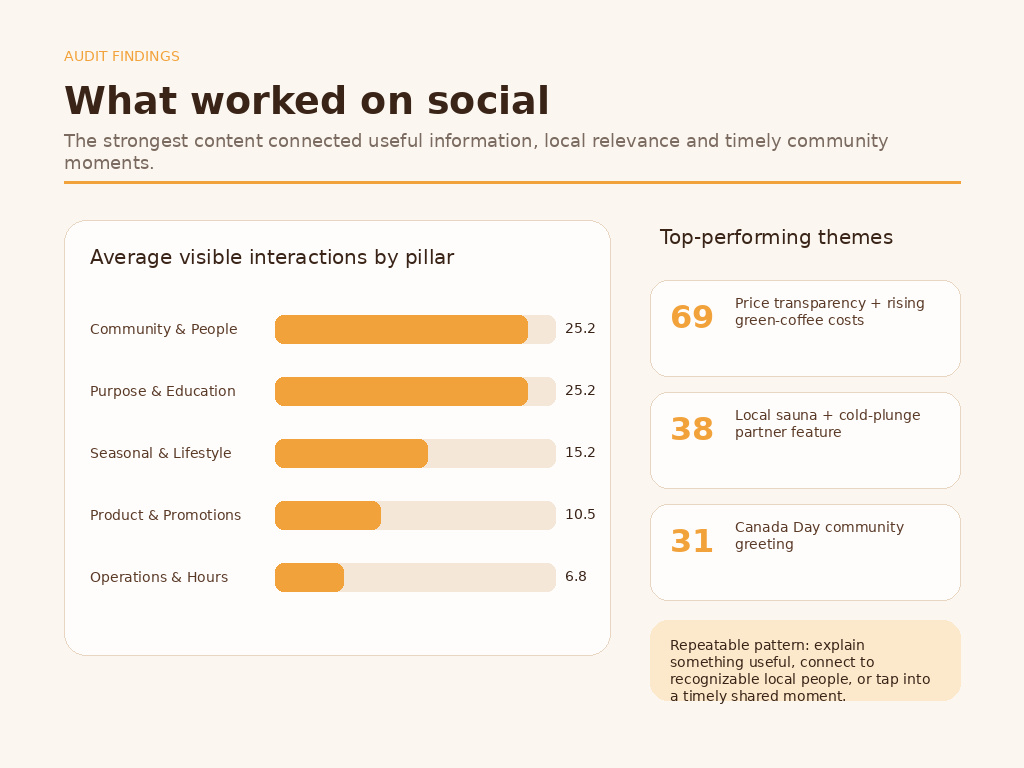
Visible likes plus comments. These are public interaction counts, rather than reach or conversion results.
| Content pillar | Audited posts | Audit share | Proposed share |
|---|---|---|---|
| Community & People | 6 | 22.2% | 30% |
| Product & Promotions | 5 | 18.5% | 25% |
| Purpose & Education | 5 | 18.5% | 20% |
| Seasonal & Lifestyle | 5 | 18.5% | 15% |
| Operations & Hours | 6 | 22.2% | 10% |
Proposed shares describe the recommended content plan. Audit shares are rounded independently.
Strategy into decisions
How I approached the work.
Make the schedule achievable
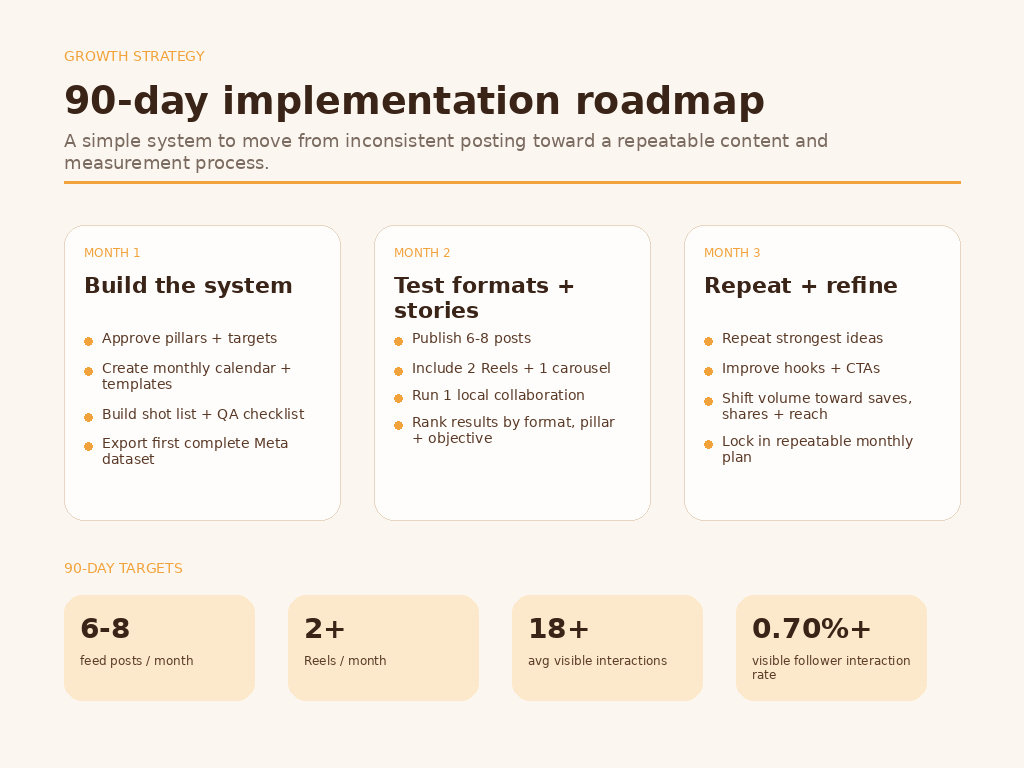
The account averaged 1.4 feed posts per month. I recommended a batched calendar of six to eight monthly posts so a small team could publish consistently.
Build around useful stories
Price transparency, a local partner feature and a community moment led the visible interaction counts. I used these patterns to prioritise people, product use and coffee education.
Give each format a job
I recommended at least two Reels and one carousel each month, with most temporary hours notices moving to Stories and Highlights.
Connect content to an action
Ten posts had no call to action. The proposed system pairs one objective with a relevant next step, such as saving a brew guide, finding a stockist or shopping a product.
Selected project visuals
The work in view.
Project outcome
Delivered a clear baseline and a repeatable content plan, with recommendations tied to the account’s actual publishing patterns and strongest visible themes.
How success would be measured
- Consistency
- Monthly posts against the six-to-eight-post plan
- Discovery
- Reach and watch time by format from Meta exports
- Content value
- Saves, shares and replies by content pillar
- Customer action
- Website clicks, stockist interest and attributed shop activity where tracking is available